


Using Power Query to clean data in Power BI


Although most of my data cleaning is conducted with Spark in Databricks, there are scenarios where my data doesn't need to undergo heavy transformations.
If I can get my data to the output I need in just a few short steps, why not do that?
In this blog I'll walk you through how I go about performing data cleanses with Power BI's notorious transformation tool - Power Query.
Demo data
The data used in this blog is a CSV file that contains all table rankings from the English Premier League from the start of the 2022/23 season till the date of this writing (08/03/2023). This was scraped from the web (ethically😇) using a custom scraper I built with Python.
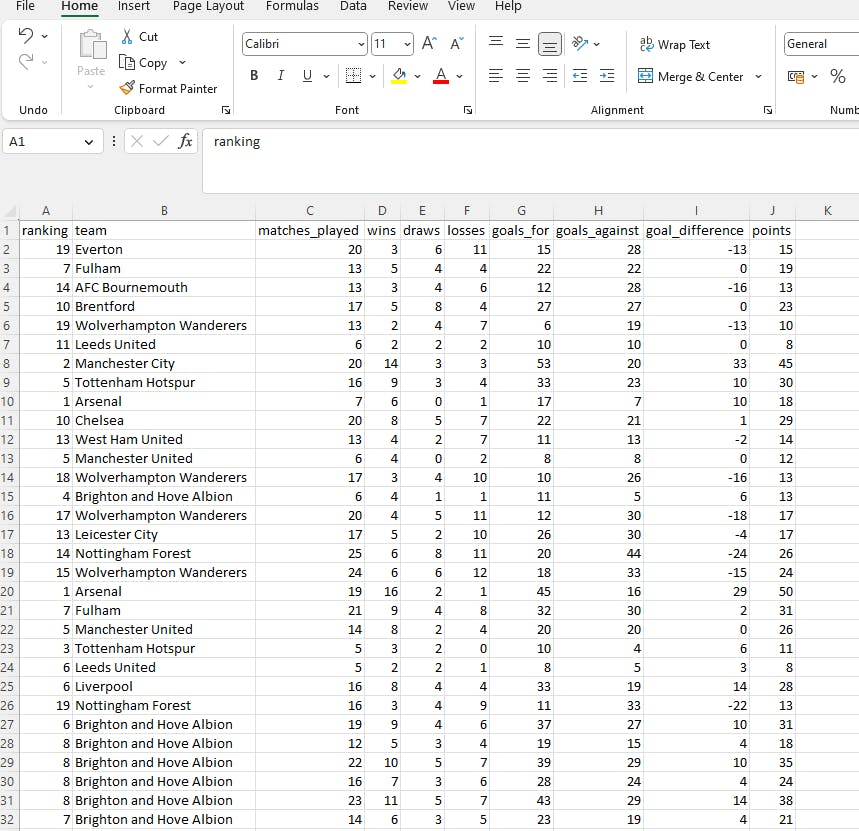
It may not be immediately obvious but this data contains all sorts of problems like duplicated records, teams sharing the same ranks, odd characters and column naming convention that gives me the ick. This will all change with Power Query real soon.
Transformation
Because I have no date column in my data, I would need to come up with a clever method of only displaying the latest rankings as of this writing.
To get this to the state I desire, all I need is 2 steps:
Group the records by team
Filter results to the latest records
Rename the column names
These intentions must now be translated to Power Query logic.
Here's how I'm going to do it.
1. Group the records by team
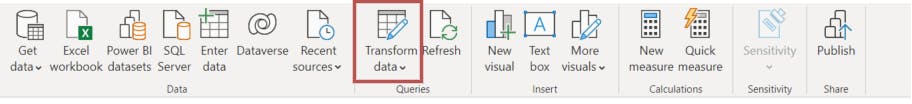
In Power BI:
- In the Queries pane click Transform data
Click on the team column
On the Home tab click Group By in the Transform pane
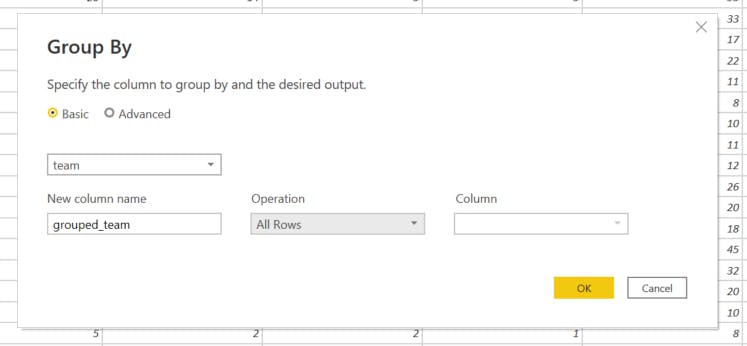
Enter a name for the new column and click All Rows under the Operations drop-down menu
Click OK
This should group the data by team names. My first transformation intent is now complete.
2. Filter results to the latest records
Because I've scraped and appended each Premier league table from the start of the 2022/23 season till date to a CSV file, this will inevitably show multiple rows of data containing each team's rankings over the past couple of months.
But right now I'm not interested in seeing this - I only want to see the latest table standings possible.
Here's how I go about this one:
Click on Add Column tab and click on Custom Column. This creates a new column for my aggregate column
Enter a column name for this new column e.g. max_matches_played
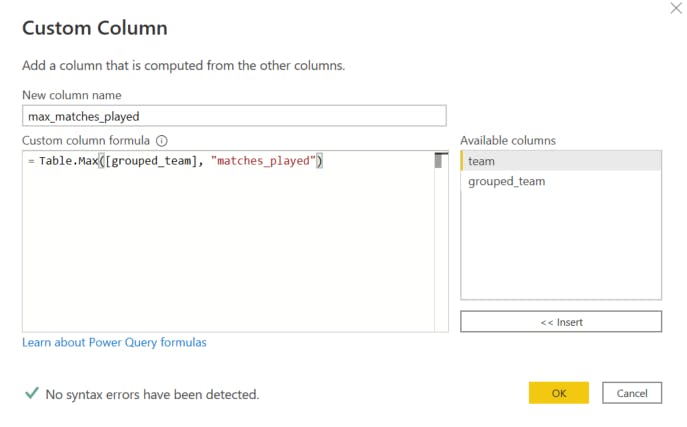
Enter a custom formula to filter grouped results to only the team records with the most matches played i.e.
=Table.Max([grouped_team], "matches_played")Click OK
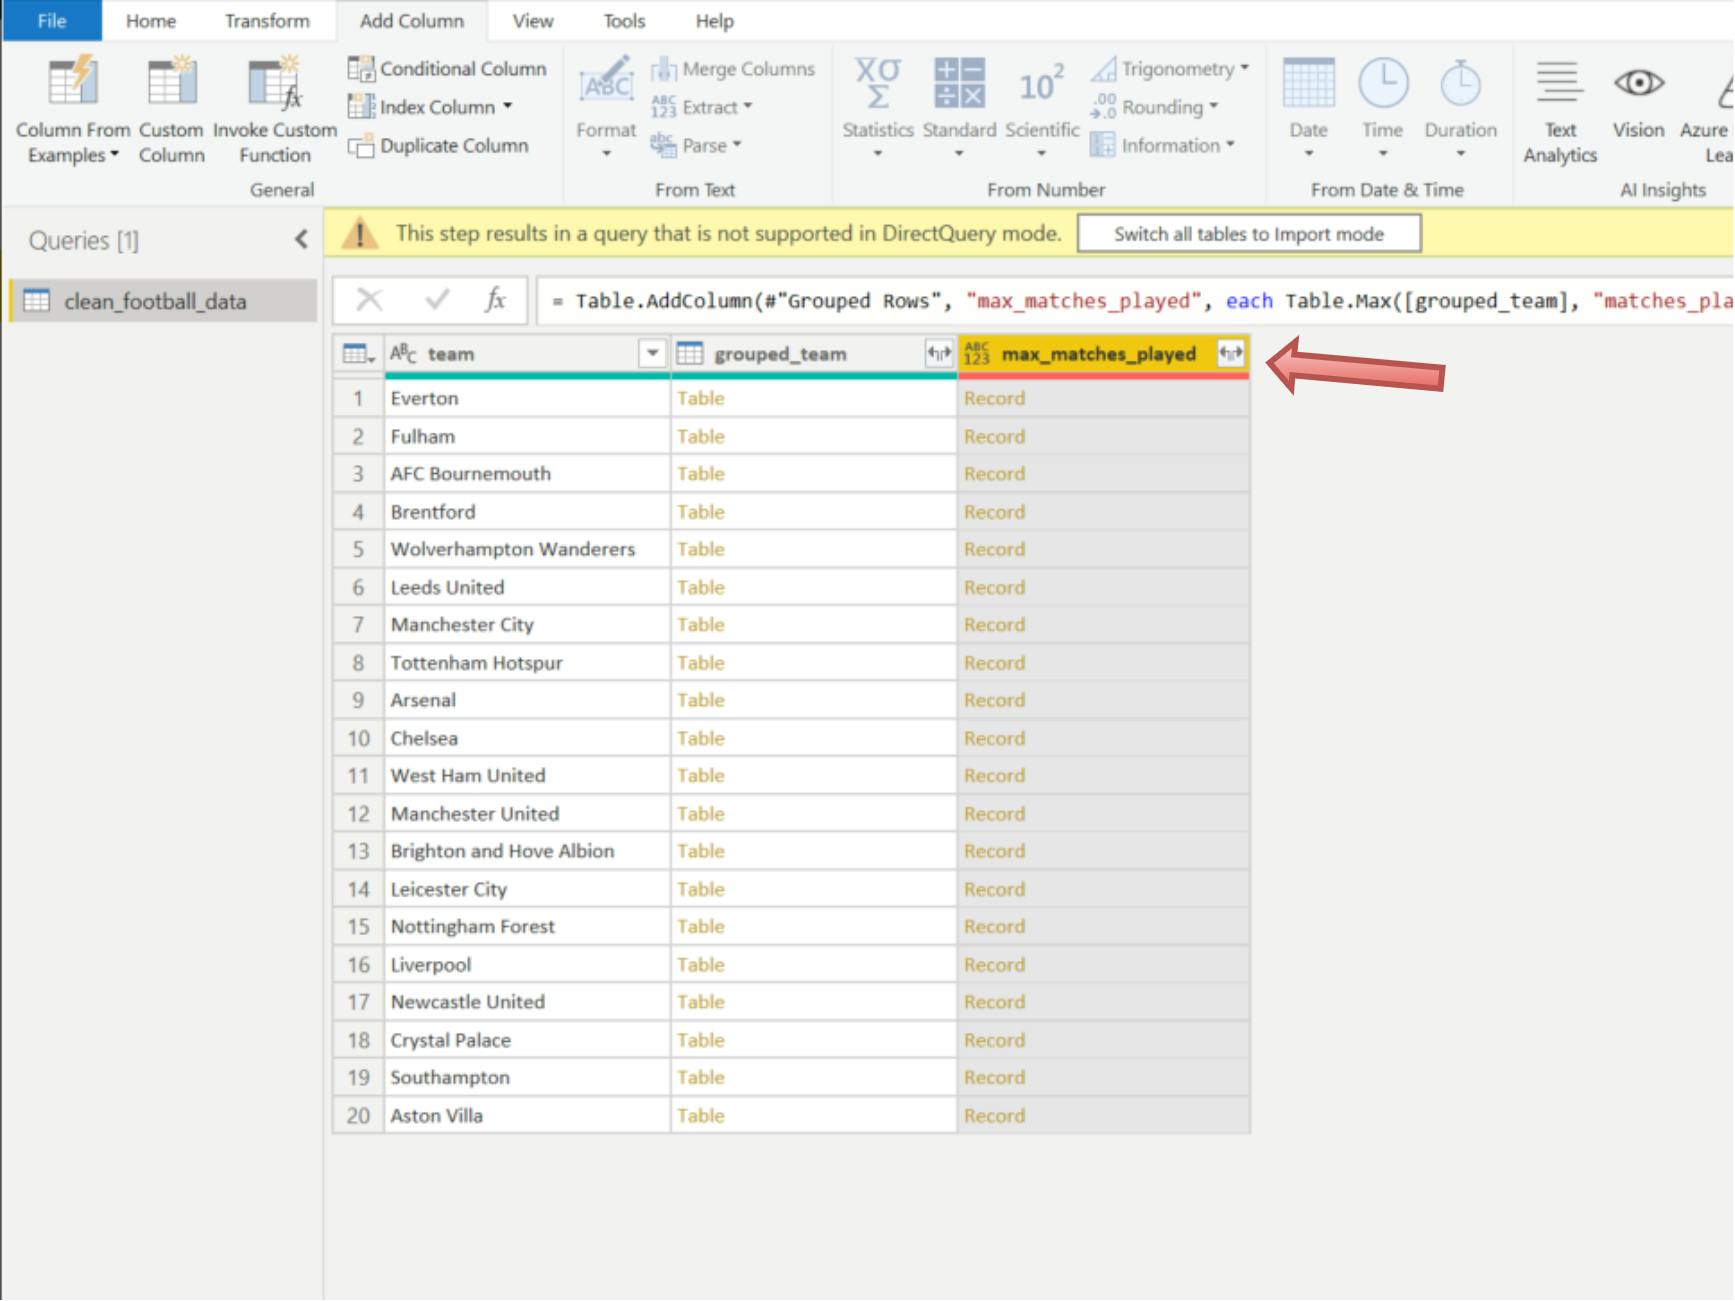
Click on the expand button of the new custom column (next to its header) to expand it
Sort it by ranking it in ascending order
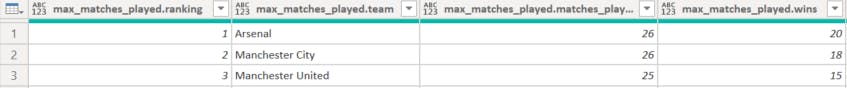
3. Rename the column names
The final step is simple in Power Query - renaming the columns. Here's what the old names look like:
...and here's what the new names look like:
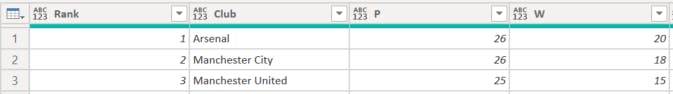
...all I did was double-click into each column name and rename them as I wished!
Results
Once I've reviewed the changes made, I click Close & Apply and let the transformations flow into our console.
Then I use the cleaned data to create the league table, and here is the output:
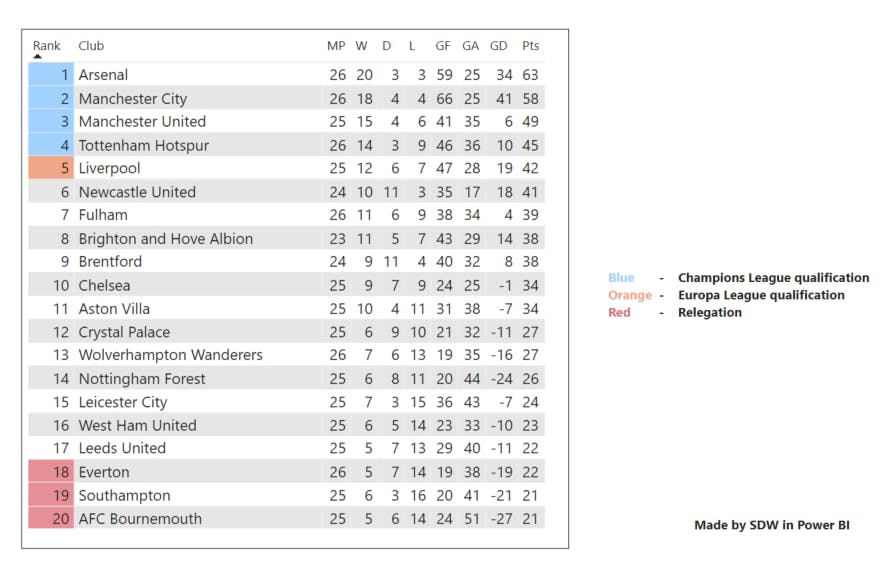
After using the table visualization, I have now been able to create my very own version of the Premier League table (as of 08/03/2023)!
Conclusion
So whenever your datasets contain minimal data quality issues, Power Query can be a great transformation tool for getting your data from unclean to production-level ready for your reporting pipelines.
If the cleaning process is not complicated and the datasets are not huge, then Power Query is powerful enough to handle these use-cases.
If you want to build reporting pipelines that contain sophisticated transformation steps, there are features that integrate Power BI and Python, Spark or R seamlessly with each other, but that's for another blog post.
Feel free to reach out via my handles: LinkedIn| Email | Twitter